
Your Say on Super: Three key insights from our latest national survey

Australians are paying more attention to their super, but gaps remain in confidence and knowledge across generations.
Most Australians will rely on super for a large part of their retirement income.
The decisions people make throughout their super journey can shape whether retirement is comfortable or financially tight. Actions like not checking your super balance or reviewing insurance can lead to significant losses in retirement savings over time.
To understand how Australians are actually experiencing these decisions in real life, Super Consumers Australia runs the recurring national survey, Your Say on Super.
The research looks at how confident people feel making decisions about super, what they understand about the system, and where gaps in support or information are showing up.
We found more Australians are paying attention to their super than in previous years. But confidence has not kept pace. Many people still don’t feel confident making decisions about their super, even as they become more engaged with it.
This trend can be seen across all generations, although younger Australians face the biggest challenges. Gen Z and Millennials are less likely than older generations to feel engaged with their super and less likely to feel confident making decisions about it.
The survey also highlights important gaps in people’s knowledge of super. While understanding of the system is improving overall, many Australians still struggle with more complex topics. Knowledge of insurance in super, tax and preservation age remains much lower than understanding of the basics.
Key takeaways
70% of Australians check their super, but only 56% feel confident making decisions.
28% don’t know they can change investment settings, and 20% don’t know they can make extra contributions.
A 31 percentage point engagement gap exists between Baby Boomers and Gen Z. Confidence is also lower among Gen Z (51%) than Baby Boomers (70%).
What the research shows
Insight 1: Australians are engaging more with super, but confidence hasn’t grown
There has been an increase in how often Australians are engaging with their super, both through checking their balance and reading communications from their fund.
Almost 7 in 10 working Australians (70%) say they regularly check their super balance. This is up from 64% in 2022, but similar to 2024.
70% of working Australians said they regularly keep an eye on their super balance.
Nearly 6 in 10 working Australians (60%) say they read communications from their super fund. This is up from 55% in 2022 and similar to 2024.
60% of working Australians said they read communications from their super fund.
Figure 1
Trends in people’s engagement with super (2022 to 2025).
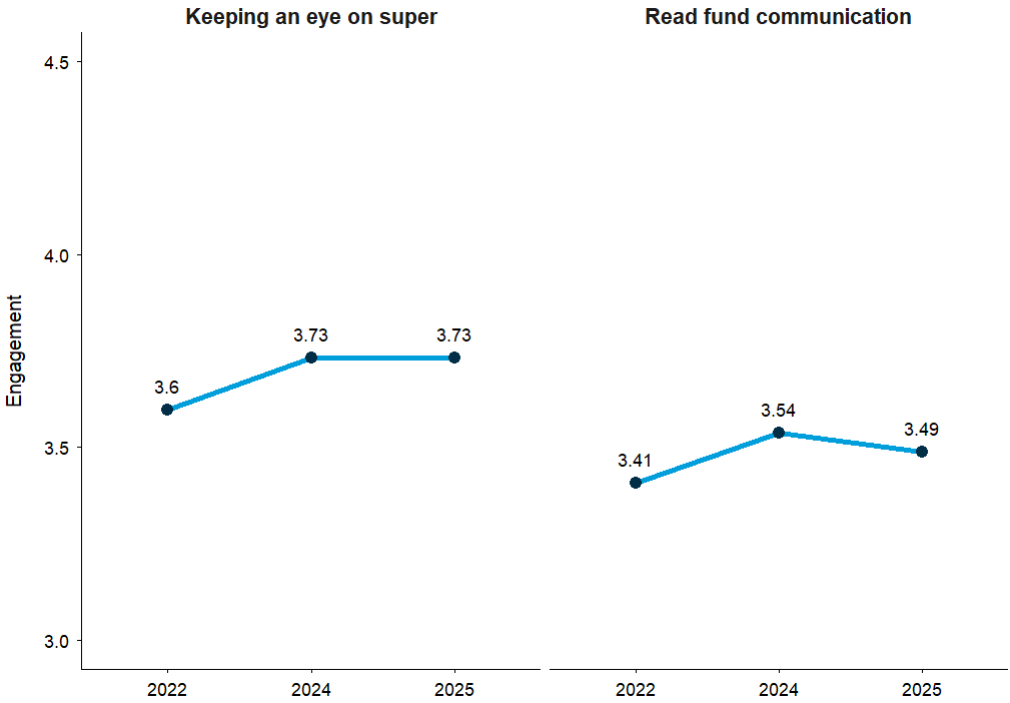
Note: We asked people how much they agree or disagree with each statement on a 1–5 scale (1 = strongly disagree, 5 = strongly agree). Higher scores indicate higher engagement. “I don’t know” responses were excluded. Results include respondents who are not retired. Changes between 2022 and 2025 were statistically significant (p < .05), while changes between 2024 and 2025 were not (p > .05). Full data is in Tables 2 and 3 (accessible version).
Confidence has not improved alongside engagement
Despite rising engagement, confidence has not grown alongside it. Only 56% feel confident making decisions about their super, and confidence has not changed since 2022 (see Figure 2).
Making decisions about super can mean weighing up investments, insurance, retirement income, or whether to change funds. Without confidence, people may be more likely to put decisions off or stick with default settings.
Despite rising engagement, just 56% of Australians feel confident making decisions about their super.
Figure 2
Trends in people’s confidence in making decisions about their super (2022 to 2025).
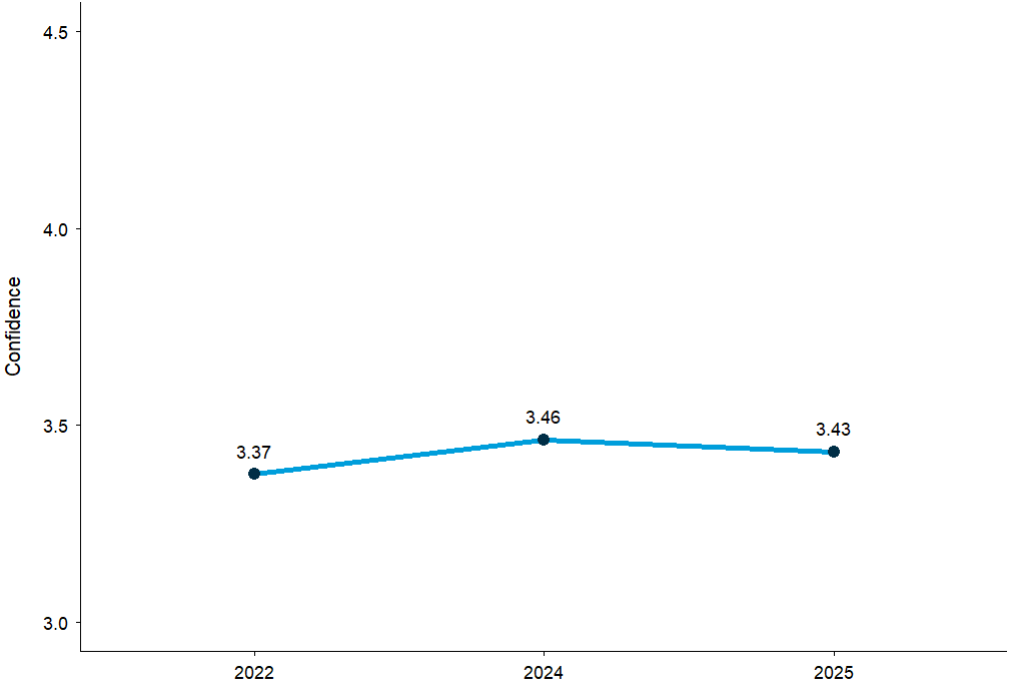
Note: We asked people how much they agree or disagree with each statement about confidence in making decisions about their super, using a scale from 1 (strongly disagree) to 5 (strongly agree). Higher scores indicate greater confidence. “I don’t know” responses were excluded. Results include people who are not retired. Average scores from 2022, 2024 and 2025 were not statistically significantly different (p > .05), indicating no meaningful change over time. Full data is in Table 4 (accessible version).
Insight 2: Super knowledge is improving, but gaps remain in more complex areas
Australians are increasingly familiar with the basics of superannuation. But gaps remain in the areas that matter most when making real financial decisions.
There is also a clear link between knowledge and confidence. People who feel more confident making super decisions tend to score higher on knowledge questions.
Australians with the highest confidence in making decisions about super scored 23% higher on knowledge questions than those with the lowest confidence.
More Australians understand the basics of super, but gaps remain
While more Australians are understanding the basics of super, some key rules are still not widely understood.
Understanding that employers must pay super has increased slightly, from 88% in 2022 to 91% in 2025.
Knowledge of the super guarantee rate has also improved, rising from 51% to 67% over the same period.
But gaps remain when it comes to how super works in practice.
For example:
- 9% of Australians do not know employers are legally required to pay super
- 20% do not know they can put extra money into their super
- 28% do not know they can change how their super is invested after joining a fund
Without basic knowledge of how super works, people may be less able to make informed decisions about their super during their working lives, including how much they contribute or how their money is invested.
28% of Australians do not know they can change how their super is invested after joining a super fund.
Insurance and tax are the least understood areas of super
Insurance and tax are the areas Australians struggle with the most, with the highest levels of incorrect or “don’t know” responses at 58% and 54% respectively.
More than half of Australians (54%) did not know that money paid into super by employers is taxed at 15% (See Table 9 in Appendix).
There is also uncertainty around more complex processes, including how insurance through super works and how complaints or claims are handled, including those involving the Australian Taxation Office (ATO).
These are among the more technical parts of the super system, where understanding is lower compared to other areas.
More than half of Australians (54%) did not know that money paid into super by employers is taxed at 15%.
Figure 3
Trends in people’s knowledge of super concepts by general versus specific concepts (2022–2025)
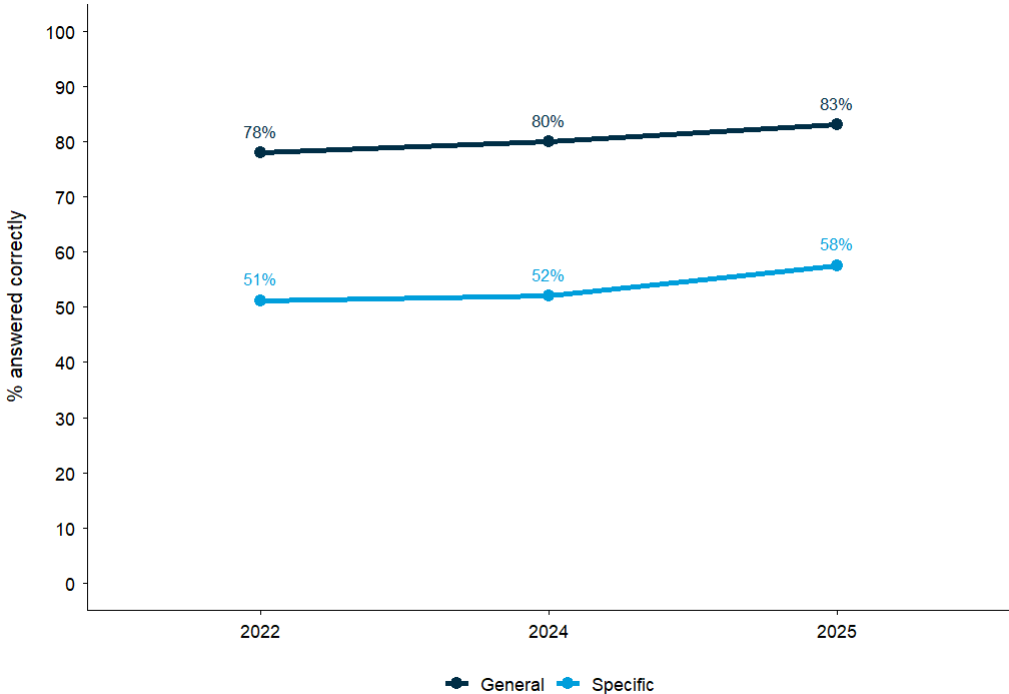
Note: We asked Australians questions about super covering both basic and more complex topics such as insurance, tax and access to super. Higher scores indicate a higher share of correct answers. Four complex questions were included in 2022, increasing to five from 2024 after an additional question was added. Differences between basic and more complex concepts were statistically significant (p < .05). Full data is available in Tables 8 and 9 (accessible version).
Insight 3: Generational gaps are clear when it comes to super knowledge
Age plays a strong role in how Australians engage with and understand super. Younger Australians are consistently less engaged, less confident, and less likely to understand key features of the system compared to older generations.
Engagement and confidence vary by generation
A key finding is a 31 percentage point engagement gap between Baby Boomers and Gen Z and a 19 percentage point confidence gap.
Gen Z reports the lowest confidence in making decisions about super, at 51% in 2025, compared with 70% of Baby Boomers.
Gen Z also records the lowest engagement scores across all measures.
This means younger Australians are less likely to feel confident engaging with their super at a stage when they are making key decisions about contributions, investments, and fund choice.
Only 51% of Gen Z feel confident making decisions about their super
Figure 4
Engagement and confidence scores across generations in making decisions about super
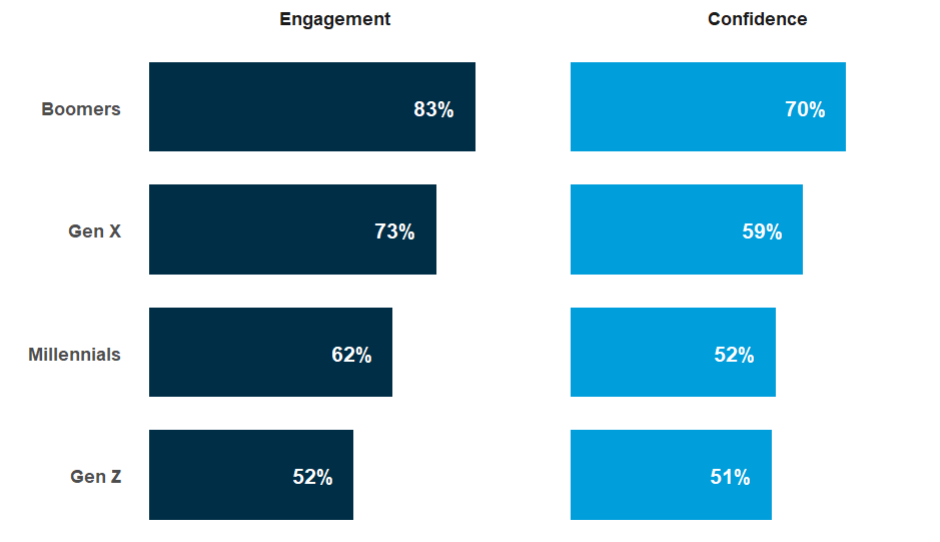
Figure 5
Trends in people’s engagement with their super by generation (2022 – 2025).
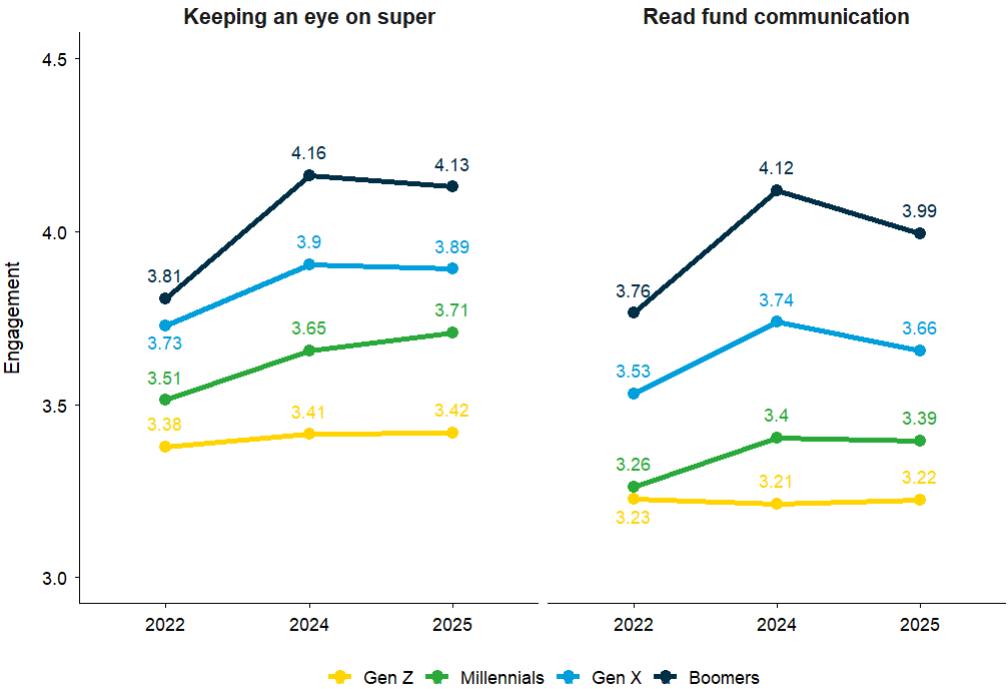
Note: We asked Australians how much they agree or disagree with statements about their engagement with super on a 1–5 scale (1 = strongly disagree, 5 = strongly agree). Higher scores indicate greater engagement. “I don’t know” responses were excluded. Results include people who are not retired. Differences in engagement between generations were statistically significant (p < .05). Full data is available in Tables 5 and 6 (accessible version).
Different cohorts show different knowledge gaps
The findings also show that people tend to have knowledge gaps in the areas most relevant to their stage of life.
Gen Z are less likely to know basic rules, with 21% unaware that employers are legally required to pay super.
Millennials show lower understanding of insurance in super, with 57% saying they do not understand how default insurance works.
Gen X are less aware of some investment settings, including that super investment options can be changed after joining a fund (22% were unaware).
Baby Boomers are more likely to report gaps in retirement-related aspects of super, including decisions about retirement income and death benefit nominations.
The big picture
The findings show a consistent pattern across the super system.
More Australians are paying attention to their super, but this does not always translate into confidence when making decisions. At the same time, while basic understanding is improving, important gaps remain in more complex areas like insurance, tax, and investment settings.
These gaps are not evenly spread. They differ by life stage, with younger Australians more likely to lack basic knowledge, and older Australians more likely to face gaps around retirement planning.
Taken together, the results point to a system where people are more engaged than before, but still not consistently supported with the knowledge and confidence needed to make decisions at key points in their super journey.
About Your Say on Super
Your Say on Super is a recurring consumer survey run by Super Consumers Australia. The aim is to understand how Australians experience, engage with, and make decisions about their super in real life. It is a nationally representative survey that provides insights into where people need better support, clearer information and stronger protections to navigate an increasingly complex super system. These insights are used to influence policymakers and hold super funds accountable in our fight for a fair super system.This research was supported by a philanthropic grant from Ecstra Foundation. Ecstra is committed to building the financial wellbeing of Australians within a fair financial system
Citation
Super Consumers Australia. (2026, June 17). Your Say on Super: Three key insights from our latest national survey (https://superconsumers.com.au/research/your-say-on-super-three-key-insights-from-our-latest-national-survey/).
Appendix
Our methodology
This report is based on Your Say on Super, a repeated cross-sectional national survey of Australians aged 18–75.
Across all survey waves, respondents were recruited through the same online panel provider, Online Research Unit (ORU). Surveys were completed online on any internet-enabled device, and participants were financially compensated for their time.
Before each survey, a small pre-test was conducted via ORU to check question clarity and ensure survey logic and routing worked as intended.
The survey begins with screening questions, which are asked of all respondents and determine survey pathways. Participants then answer questions about their behaviours, attitudes and expectations in relation to the superannuation system. Some questions are tailored based on age, superannuation status, and whether respondents are in the accumulation phase or retired.
Respondents then complete knowledge questions assessing their understanding of key features of the super system. These questions are largely based on the Productivity Commission’s 2018 survey of super fund members. The survey concludes with demographic questions and an opportunity to provide general feedback.
To ensure data quality, responses were excluded where two or more indicators of low-quality responding were detected. This included unusually fast completion times, straight-lining, high levels of missing responses, or inconsistent answers.
To date, three survey waves have been completed:
- Pilot/benchmark survey (N = 1,559), 25 Oct–3 Nov 2022
- Second survey (N = 1,526), 14–24 May 2024
- Latest survey (N = 4,815), 7 Aug–9 Sept 2025
Accessible versions of figures
Table 1
Trends in people’s engagement with super (2022 to 2025).
| Year | Average Engagement | Strongly Agree | Agree | Neither agree nor disagree | Disagree | Strongly Disagree |
| 2022 | 3.60 | 16% | 48% | 18% | 15% | 3% |
| 2024 | 3.73 | 21% | 48% | 18% | 9% | 4% |
| 2025 | 3.73 | 22% | 48% | 16% | 10% | 4% |
Note. This is the data shown in Figure 1 (Panel 1). Percentages have been rounded to the nearest %. ‘I don’t know’ responses were excluded from the calculations.
Table 2
Trends in people’s engagement with super (2022 to 2025).
| Year | Average Engagement | Strongly Agree | Agree | Neither agree nor disagree | Disagree | Strongly Disagree |
| 2022 | 3.41 | 11% | 44% | 25% | 16% | 4% |
| 2024 | 3.54 | 13% | 48% | 23% | 13% | 3% |
| 2025 | 3.49 | 11% | 49% | 23% | 13% | 5% |
Note. This is the data shown in Figure 1 (Panel 2). Percentages have been rounded to the nearest %. ‘I don’t know’ responses were excluded from the calculations.
Table 3
Trends in people’s confidence in making decisions about their super (2022 to 2025).
| Year | Average Confidence | Strongly Agree | Agree | Neither agree nor disagree | Disagree | Strongly Disagree |
| 2022 | 3.37 | 8% | 44% | 28% | 16% | 4% |
| 2024 | 3.46 | 10% | 47% | 25% | 13% | 4% |
| 2025 | 3.43 | 10% | 45% | 26% | 14% | 5% |
Note. This is the data shown in Figure 2. Percentages have been rounded to the nearest %. ‘I don’t know’ responses were excluded from the calculations.
Table 4
Trends in people’s knowledge of super concepts by general versus specific concepts (2022 – 2025).
| Year | General | Specific |
| 2022 | 78% | 51% |
| 2024 | 80% | 52% |
| 2025 | 83% | 58% |
Note. This is the data shown in Figure 3. Percentages have been rounded to the nearest %.
Table 5
Trends in people’s engagement with super by generation (2022 to 2025).
| Gen | Year | Average Engagement | Strongly Agree | Agree | Neither agree nor disagree | Disagree | Strongly Disagree |
| Gen Z | 2022 | 3.38 | 14% | 39% | 22% | 19% | 5% |
| Gen Z | 2024 | 3.41 | 15% | 41% | 24% | 12% | 9% |
| Gen Z | 2025 | 3.42 | 14% | 44% | 21% | 15% | 7% |
| Millennial | 2022 | 3.51 | 15% | 46% | 19% | 18% | 3% |
| Millennial | 2024 | 3.65 | 16% | 52% | 19% | 9% | 4% |
| Millennial | 2025 | 3.71 | 21% | 48% | 17% | 11% | 4% |
| Gen X | 2022 | 3.73 | 17% | 52% | 18% | 12% | 1% |
| Gen X | 2024 | 3.90 | 27% | 48% | 15% | 8% | 2% |
| Gen X | 2025 | 3.89 | 26% | 50% | 13% | 8% | 3% |
| Boomers | 2022 | 3.81 | 23% | 52% | 13% | 8% | 4% |
| Boomers | 2024 | 4.16 | 36% | 51% | 8% | 5% | 1% |
| Boomers | 2025 | 4.13 | 36% | 47% | 12% | 3% | 2% |
Note. This is the data shown in Figure 5 (Panel 1). Percentages have been rounded to the nearest %. ‘I don’t know’ responses were excluded from the calculations.
Table 6
Trends in people’s engagement with super by generation (2022 to 2025).
| Gen | Year | Average Engagement | Strongly Agree | Agree | Neither agree nor disagree | Disagree | Strongly Disagree |
| Gen Z | 2022 | 3.23 | 9% | 38% | 25% | 22% | 6% |
| Gen Z | 2024 | 3.21 | 10% | 33% | 31% | 21% | 5% |
| Gen Z | 2025 | 3.22 | 8% | 39% | 27% | 19% | 7% |
| Millennial | 2022 | 3.26 | 9% | 39% | 26% | 21% | 5% |
| Millennial | 2024 | 3.40 | 9% | 48% | 22% | 16% | 5% |
| Millennial | 2025 | 3.39 | 9% | 46% | 25% | 14% | 5% |
| Gen X | 2022 | 3.53 | 9% | 53% | 23% | 12% | 3% |
| Gen X | 2024 | 3.74 | 14% | 55% | 22% | 7% | 1% |
| Gen X | 2025 | 3.66 | 11% | 57% | 20% | 9% | 3% |
| Boomers | 2022 | 3.76 | 20% | 47% | 25% | 5% | 3% |
| Boomers | 2024 | 4.12 | 29% | 57% | 11% | 3% | 0% |
| Boomers | 2025 | 3.99 | 22% | 60% | 13% | 4% | 0% |
Note. This is the data shown in Figure 5 (Panel 2). Percentages have been rounded to the nearest %. ‘I don’t know’ responses were excluded from the calculations.
Table 7
Trends in people’s confidence in making decisions about their super by generation (2022 to 2025).
| Gen | Year | Average Confidence | Strongly Agree | Agree | Neither agree nor disagree | Disagree | Strongly Disagree |
| Gen Z | 2022 | 3.44 | 10% | 42% | 30% | 16% | 1% |
| Gen Z | 2024 | 3.30 | 11% | 36% | 30% | 17% | 6% |
| Gen Z | 2025 | 3.33 | 10% | 41% | 28% | 16% | 6% |
| Millennial | 2022 | 3.35 | 9% | 45% | 23% | 18% | 4% |
| Millennial | 2024 | 3.42 | 9% | 47% | 24% | 13% | 6% |
| Millennial | 2025 | 3.36 | 9% | 44% | 28% | 15% | 5% |
| Gen X | 2022 | 3.28 | 7% | 39% | 33% | 16% | 5% |
| Gen X | 2024 | 3.52 | 11% | 50% | 24% | 12% | 3% |
| Gen X | 2025 | 3.50 | 11% | 48% | 26% | 11% | 4% |
| Boomers | 2022 | 3.57 | 7% | 54% | 30% | 6% | 2% |
| Boomers | 2024 | 3.80 | 12% | 62% | 18% | 7% | 0% |
| Boomers | 2025 | 3.76 | 15% | 55% | 21% | 7% | 1% |
Table 8
Superannuation knowledge scores by generation (2025).
| Number of questions correct | Percentage | |
| Gen Z (18 – 28) | 5.4 | 60% |
| Millennials (29 – 44) | 6.0 | 67% |
| Gen X (45 – 60) | 6.5 | 72% |
| Boomers (61 – 79) | 6.8 | 76% |
Note. Scores are based on 9 questions (see Table 9) . Age for each generation is shown in brackets and range is inclusive. Differences between each generation were statistically significant (p < .05).
Table 9
Superannuation knowledge questions answered by consumers (2022 to 2025).
| Knowledge questions | Answers | 2022 | 2024 | 2025 |
| 1. Employers are required by law to make super payments on behalf of their employees. | True | 88%a | 89%a,b | 91%b |
| False | 3% | 4% | 4% | |
| I don’t know | 9%b | 7%a,b | 6%a | |
| 2. People can select a super fund of their own choice. | True | 88%a | 88%a | 91%b |
| False | 4%a,b | 6%b | 4%a | |
| I don’t know | 8% | 7% | 6% | |
| 3. Employees can’t contribute into their own super account – only an employer can make contributions. | True | 9% | 12% | 11% |
| False | 76% | 78% | 80% | |
| I don’t know | 14%b | 10%a | 10%a | |
| 4. A person can complain to the Australian Tax Office (ATO) about any unpaid super. | True | 68% | 70% | 69% |
| False | 5% | 5% | 6% | |
| I don’t know | 27% | 25% | 25% | |
| 5. People can’t change how their super is invested after joining a super fund. | True | 14% | 16% | 15% |
| False | 61%a | 66%b | 72%c | |
| I don’t know | 25%c | 18%b | 14%a | |
| 6. The current rate of Superannuation Guarantee contributions (i.e. the amount of super an employer has to pay) is 10.5% / 11% / 12%. | True | 51%a | 56%b | 67%c |
| False | 10%b | 8%a,b | 7%a | |
| I don’t know | 39%b | 35%b | 26%a | |
| 7. People can usually access their super when they turn 50. | True | 18%b | 24%c | 15%a |
| False | 52%a | 54%a | 63%b | |
| I don’t know | 30%b | 22%a | 22%a | |
| 8. If you are over 25 years old, super funds will normally automatically enrol you to their default insurance. It is up to you to opt-out if you don’t want it. | True | n/a | 39% | 42% |
| False | n/a | 13% | 13% | |
| I don’t know | n/a | 47% | 46% | |
| 9. Money paid into an employee’s super account by employers is taxed at the rate of 15%. | True | 33%a | 41%b | 46%c |
| False | 13% | 13% | 13% | |
| I don’t know | 53%c | 46%b | 40%a |
Note. Percentages have been rounded to the nearest %. Correct answers are shaded. Questions are ordered by the average percentage of correct answers over time.
a,b,c Within a row, the percentage without a common superscript differs (p < .05).
Question 8 was first introduced in 2024. Question 1, 2, 3 and 5 are classified as general questions while question 4, 6, 7, 8 and 9 are classified as specific questions.