
Your Fees, Your Super: changes to MySuper fees since the performance test was announced
Introduction
The Your Future, Your Super (YFYS) performance test was announced in October 2020. Since then, superannuation trustees have prepared for and responded to their MySuper products being subject to a performance test. During this time, there have been a number of changes to the MySuper market, including fee changes, mergers and business restructuring. Given the consequences of failing the test, it is reasonable to assume that many of these changes have been driven by its introduction.
This analysis aims to understand the changes to MySuper fees that have taken place since the test was announced and contribute to the evidence base on the impact of the test.
Background
The 2021 performance test assessed MySuper products against a combined benchmark reflecting investment performance and administration fees. Investment performance was tested over 7 years relative to a benchmark portfolio, based on the product’s Strategic Asset Allocation. Administration fees for one financial year were assessed relative to the median MySuper administration fee. The combination of these two parts of the test means that investment fees were factored in for 7 years, whereas administration fees were considered for one year. The test included a 50 basis point grace ‘buffer’, meaning MySuper products had to underperform the combined benchmark by at least 50 basis points to fail the test.
Our hypothesis was that funds with MySuper products that did fail or were in the buffer zone would have reduced their fees by more than funds that performed above the benchmark. Given the way administration fees are accounted for in the test, we also hypothesised that funds would make the biggest cuts in administration fees rather than investment fees in order to improve their performance against the test.
To test this, we sought to understand the trends in fee changes for three groups of MySuper products – those that failed the first performance test, those in the buffer zone and those that passed. We also wanted to test our hypothesis that administration fees would have fallen by more than investment fees.
Our approach
For this analysis, we used APRA time series data from 30 September 2020 to 30 June 2022 on MySuper fees. We analysed the fees charged on a $50K balance and have focused on the averages for three groups of MySuper products. Using the results of the 2021 performance test, the three groups are ‘fail’, ‘buffer’ (products that passed but were in the ‘buffer zone’ below the benchmark) and ‘pass’ (all remaining funds in the quarterly MySuper APRA data). Where a fund has merged or a MySuper product has been consolidated, we have assumed that the transferred MySuper members have received the fee structure (as reported in the APRA data) of the receiving MySuper product. For more information on our methodology, refer to the Appendix.
Changes to fees since Your Future, Your Super was announced
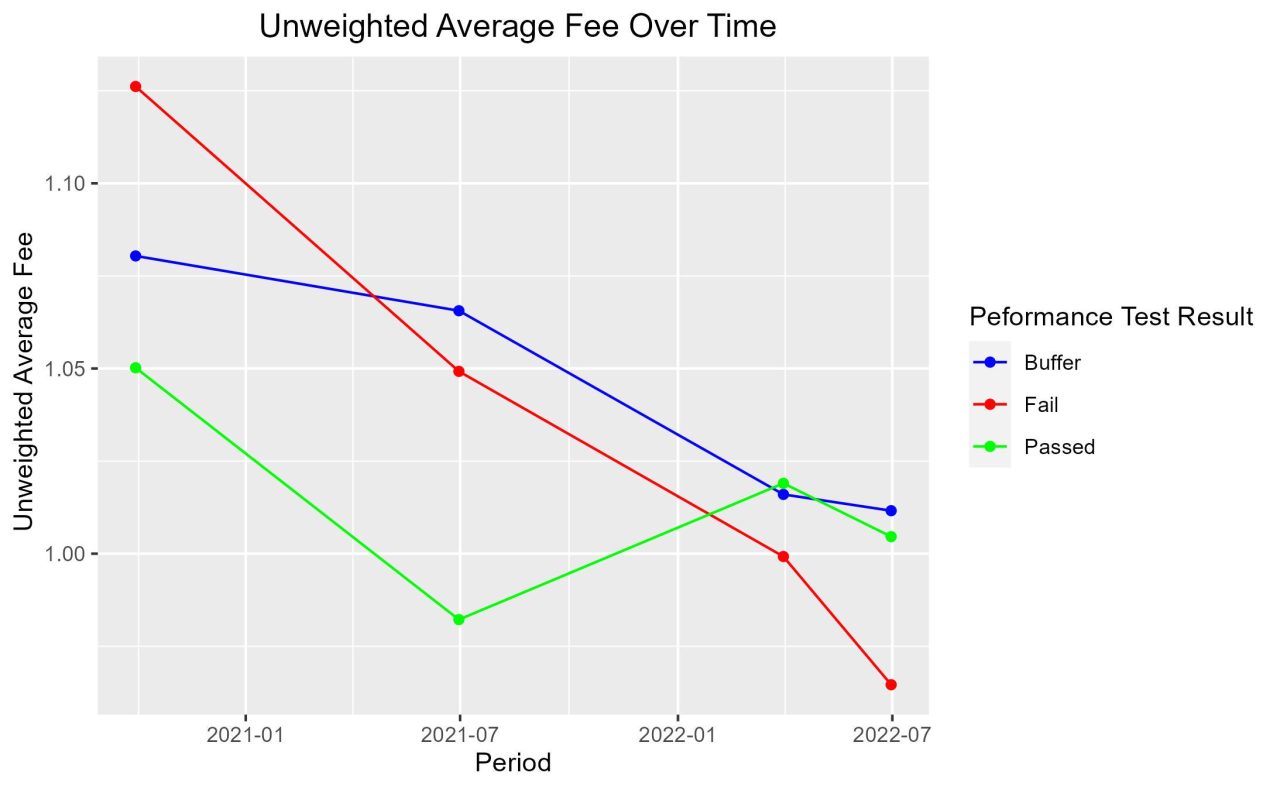
The changes in unweighted average representative fees1 for the ‘fail’, ‘buffer’ and ‘pass’ groups are shown in table 1 and the chart below. As hypothesised, the biggest reduction in the unweighted average fees for Mysuper products was among products that failed the 2021 performance test, reducing 16bps or 14.34%. For MySuper products in the ‘buffer’ group, the reduction in unweighted average fees was smaller at 7 bps or 6%. This compared to an even smaller 5 bps or 4.34% decrease in unweighted average fees for MySuper products that passed the 2021 test.
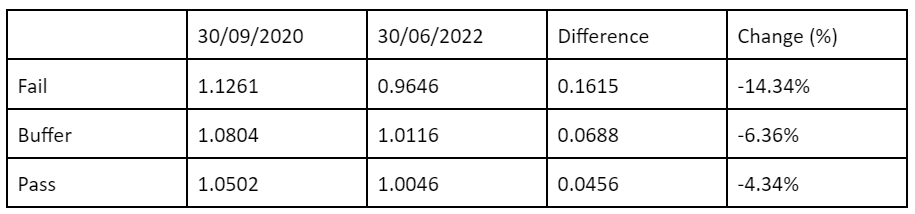
Table 1 – average fee for fail, buffer and pass groups
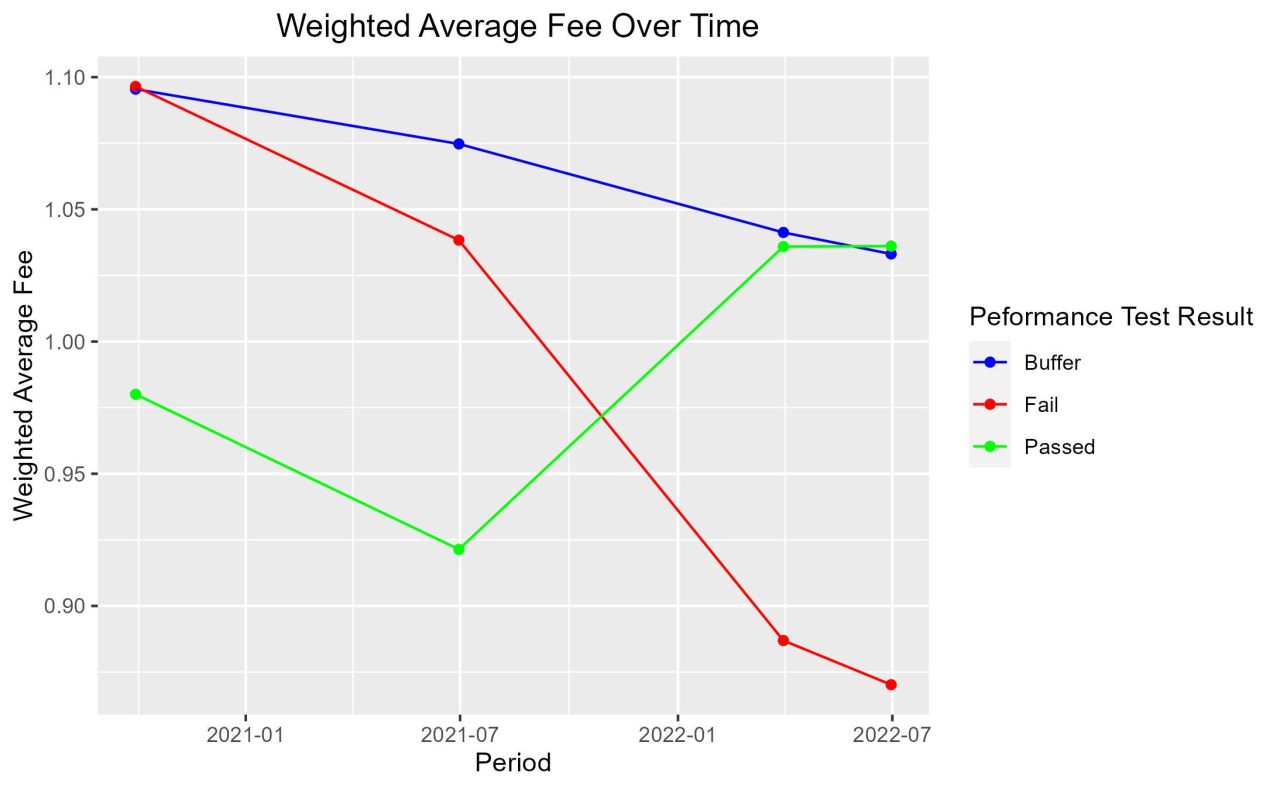
Weighted average fee change
Weighting by fund size (asset weighted) to account for variance in fund size results in an even bigger percentage reduction in average fees in the fail category of 20.64%. Interestingly, for the pass group, the asset-weighted average fee actually increased by 5.71%. This result is driven by the increases that some large funds reported during the June 2021 to June 2022 period. These results are shown in table 2 and the chart below.
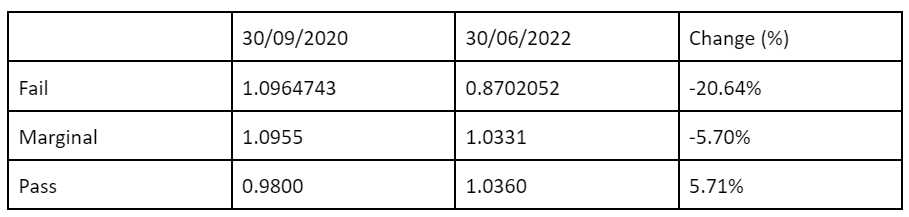
Table 2 – asset-weighted average fee for fail, marginal and pass groups
Admin fee and investment fee changes
Finally, to test our expectation that administration fees would have fallen by more than investment fees, we have split the fees for a $50K balance into the administration fee and investment fee component. The change in unweighted average administration and investment fees for the fail, buffer and pass groups are set out in tables 3 and 4. This validates our hypothesis that the reduction in administration fees has been greater than investment fees. The percentage change in unweighted average administration fees is more substantial for administration fees than investment fees, for all three groups.
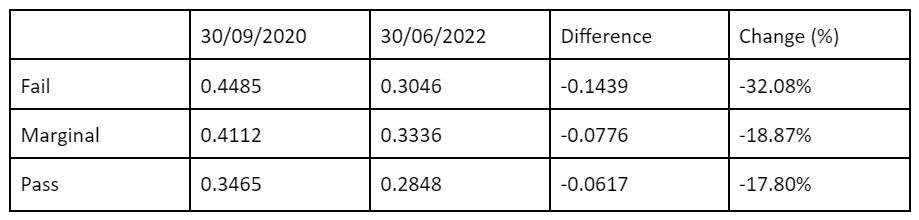
Table 3 – Administration Fee

Table 4 – Investment (including ICR) Fee
Implications and conclusion
The reductions in average fees for MySuper products in the fail and buffer zone groups suggests that the performance test is driving tangible benefits for consumers. At the same time, 10 of the 13 MySuper products that failed the first performance test are in the process of merging with a higher performing fund, or have already merged. Two others have made improvements to avoid failure a second time, leaving just one product that failed the 2021 performance test yet to resolve its underperformance. Together, these outcomes suggest that in a short period of time the performance test has been effective in chopping off the tail of underperformance in MySuper products.
Under the current performance test, funds are incentivised to outperform the benchmark. However, the incentives to outperform beyond the benchmarks set by the test are limited. The performance test is, and was always meant to be, the first step to ensuring a better-performing super system. In order to improve long-term member outcomes, the performance test needs to be complemented with other measures which drive healthy competition and encourage outperformance. Our finding that weighted average fees for the pass group have increased could reflect the lack of competitive pressure in this segment of the market. It may be that large funds who are comfortably above the benchmark are responding to the performance test by increasing their fees. However, while the weighted results are more representative of the average consumer’s experience, we note that the unweighted average fee for the pass group has still decreased. Nevertheless, we see the finding as an indicator which supports the need to assess how the default allocation model and other reforms could better drive positive member outcomes and complement the test.
Finally, our finding that unweighted average administration fees have fallen by more than investment fees suggests that funds are making the most of the test design to improve their standing in the test. Unlike investment fees, which are based on historic levels, the test uses administration fees for the past financial year. Our findings suggest that funds are responding to this feature of the test as expected.
Appendix 1 – data and methodology
The main dataset for this analysis was Sheet 3 in APRA’s Quarterly MySuper statistics time series data for September 2020 – June 2022. This is a quarterly dataset that provides a snapshot of the key indicators of each fund’s MySuper offerings.
Fees on a balance of $50,000 was chosen as the main measure to analyse. $50,000 was selected because it is the standardised amount that is used in fee disclosures and it is the amount that is used to assess administration fees in the performance test. Using a fixed relatively low balance also reduces issues associated with capped percentage based fees.
The reported Indirect Cost Ratio and investment fee were added together to form an “investment fee (including ICR) metric”. The dataset provides a representative admin fee on a balance of $50,000. This was added to the investment fee (including ICR) metric to form a representative total fee. This fee is the amount of fees that a person with a $50,000 balance would be expected to pay if they were enrolled in the fund. It excludes activity fees such as advice fees as these are not incurred by all members.
In September 2020, the dataset had information on 88 MySuper products. By June 2022 this had fallen to 69 products. This is due to a number of mergers and some product rationalisation in recent years. To manage this, the funds that had ceased to exist in the dataset, were added back into the dataset with the fee structure of the receiving product, as outlined below.
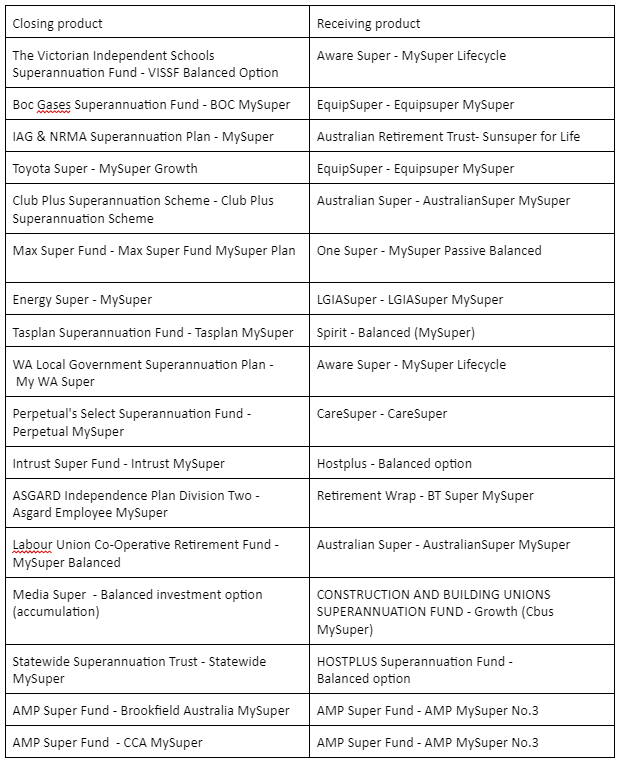
Table 5 – Fund Closures and Mergers
MySuper products were assigned to three categories (pass, buffer, fail) based on their performance in the 2021 FY performance test. Fail was assigned to the 13 products that were deemed to fail (below the 0.5% buffer beneath the benchmark) while buffer represents 26 products that scored between -0.05% and 0% in the APRA heat map. Pass was assigned to the remaining 49 funds.
To account for differences in fund size, the asset-weighted averages are weighted by fund size based on MySuper assets as at June 2020.
1 Unless otherwise specified, references to fees represent the total of administration fees and investment fees (including the ICR) for a $50K balance.