
Insights from our survey about how older Australians are using their super

Super Consumers Australia commissioned a survey of 1,100 people aged 65 and older that asked them about how they are using their superannuation. The survey was conducted by Susan Bell Research in August 2023. We commissioned this survey to better understand the decisions people are making about moving from the accumulation to the drawdown phase of super, and to understand what influences how they draw down their balances in retirement.
Key Insights:
- About 80% of older Australians feel financially comfortable or are getting by on their current income, and most are not overly concerned about their ability to afford future health or aged care costs. However, renters, people with a disability, and people who no longer have any super report much lower levels of financial comfort.
- Many older Australians who have a super account in the accumulation phase are still working or think they may start working again. Over half (58%) of people who have an inactive accumulation account (which they are no longer contributing to) said they do not need to start drawing on their super.
- About 61% of retirees in the drawdown phase drew down only the minimum amount from their super required by legislation in 2022-23. Most of these people are content that the legislated minimum will meet their needs because they don’t need to spend any more money (56%), they are following advice they are given (37%), or they have other sources of income (30%). For some of these people, drawing at the minimum helps them maximise their tax concessions. Few people were drawing down at the minimum because they were worried about future health care or aged care costs (14%).
- However, some people did not have a good understanding of how the retirement system works. A fifth (19%) of people who were drawing down at the minimum rate said they were doing so because they thought the minimum was a government recommendation, and mMore than half of people in our survey did not have a good understanding of how super is taxed in accumulation and retirement.
- Fewer than half (43%) of people in our survey said they have sought some kind of advice about money in retirement, and only 21% said they would trust advice from a super fund. There is room for the Government to improve the independent guidance that it delivers, for example by tasking an independent agency to connect Australia’s government-provided retirement planning services and tools through a single portal.
- Government needs to make the retirement system safer for everyone, not just those who are engaged or seek advice. Unlike the accumulation phase, there are no default products, no performance tests and no recommended drawdown rates in the drawdown phase of super.
Who we surveyed
We surveyed 1,100 Australians aged 65 and older. We targeted people over the age of 65 who had, or previously had, superannuation. Our sample excludes people who have defined benefits or annuities, and people who have never had super. For more information about our method and sample, see the appendix at the end of this article.
Just over a third (38%) of people in our sample reported that their super was in the drawdown phase, meaning that they had commenced withdrawing their money from super (see chart 1). This subsample had a higher percentage of males (61%) to females (39%), and higher reported super balances on average. For example, 38% of people in the drawdown phase reported having a super balance of more than $500,000, compared to 27% for people who were not in the drawdown phase.
Chart 1: Demographics of our survey sample:

Many older Australians feel financially comfortable
Our research found that about 80% of older Australians feel financially comfortable or are getting by on their current income. This includes people who are still working, and those who have retired.
When asked about how they feel about their current income:
- 44% of people said they were living either quite comfortably or very comfortably
- 37% said they were “getting by”
- 17% said they were finding it either fairly difficult or very difficult to get by on their current income.
Most people who are drawing down their super said they are financially comfortable. In this group:
- 68% said they were living either quite comfortably or very comfortably
- 27% said they were “getting by”
- Only 4.1% said they were finding it either fairly difficult or very difficult to get by on their current income.
This echoes previous findings. For example, Treasury’s Retirement Income Review cited evidence that the large majority (88%) of recent retirees claim to be financially satisfied, and most are happier in retirement than during working life.1 Research by the Grattan Institute found that levels of financial satisfaction in retirement are high across all income levels. 2
The survey results also show that most older Australians are not overly concerned about their ability to afford future health and aged care costs.
When we asked people how aged care factored into how they managed their money in retirement:
- 83% said they were not thinking about future aged care costs
- 10% said they were spending less so they will have enough money for aged care
- only 3.8% said they were deliberately withdrawing less from their super so there will be enough money for aged care in some form.
Responses were similar for health care costs:
- 61% of people said they were not thinking about future health care costs
- 14% said they were spending less so they will have enough money for health care
- only 4.5% said they were deliberately withdrawing less from their super so there will be enough money for health care in some form.
But some groups are much less financially comfortable
Overall, almost one in five people said they were finding it fairly difficult (12%) or very difficult (5.5%) to get by on their current income.
However, some groups were much less likely to be financially comfortable. For example, 33% of renters in our sample said they are finding it fairly difficult or very difficult to get by on their current income, and about 60% of renters said they had no super left. Two-fifths (39%) of renters said that they were fairly or very worried about how they would afford future health care costs, and almost half (48%) said they were fairly or very worried about how they would afford future aged care costs. Unlike homeowners, renters do not have home equity to draw on to help pay for aged care.
People with a disability also reported lower levels of financial comfort. About a third (30%) of people with a disability in our sample said they found it fairly difficult or very difficult to get by on their current income.
Not having superannuation is also associated with lower levels of financial comfort. About 31% of people in our sample said that neither they nor their partner currently has any super. About a fifth (22%) of this group said they were finding it fairly or very difficult to get by on their current income, and a further two fifths (40%) said they were just getting by. Most (89%) of the people without any super were receiving the government Age Pension or another government payment (e.g. Department of Veterans Affairs pension).
Finally, our survey does not include older Australians who have never had superannuation. People in this category are likely to experience even higher levels of financial difficulty.
Many over 65s are still working or have income outside of super
For some people, retirement no longer means completely stopping work. Our survey shows that some people aged 65 or older continue to do some paid work or volunteer after they have retired from their main job, and some continue to work or volunteer well into their seventies.
Even so, most (76%) people in our sample said they had retired and were not doing any paid work. A further 8.8% of the sample said they had retired but were still doing some paid work.
The younger people in our sample were more likely to be doing some paid work. A third (33%) of respondents aged 65-69 were doing some paid work, compared to only 14% of those aged over 70.
Most people who were still working had an accumulation-phase super account (see chart 2). Most people who were retired and had stopped working had a super account in the drawdown phase, meaning they were accessing their super. Some people had both types of accounts.
Chart 2: Types of super account by working/retired status3
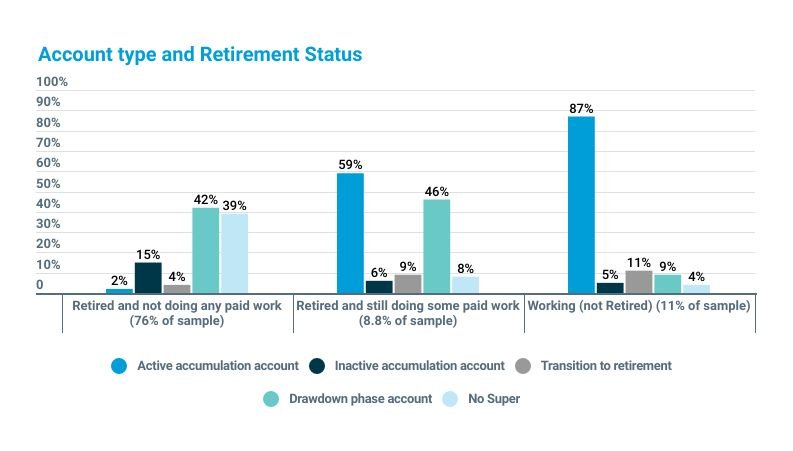
Active accumulation accounts
Of the 25% of people in our sample who still had an active accumulation account, 90% said they had this account because they were still working from time to time, and 7% said they were keeping it open for other savings or income (such as proceeds from selling property). These results show that the decision to retain an accumulation account is a deliberate decision, and reflects the fact that the system does not allow money to be contributed to a super account after it has been moved into the drawdown phase.
Inactive accumulation accounts
A minority of people (13%) in our sample had an accumulation phase account that was inactive. By this we mean that they were neither contributing money to, nor withdrawing money from, their super. On average, these accounts had smaller balances than other accounts. Among this group:
- 58% said their account was inactive because they don’t need to start drawing on their super
- 18% said it was inactive because they may start working again and will need an account to contribute to
- 13% said it was inactive because they were not sure what to do with the account.
These results show that the majority of people aged 65 or older with an inactive accumulation account have made a deliberate decision to keep their account open, even if they are not currently working and making contributions. However, there is a small number of people who are unsure what to do with their super. These people would benefit from better system design and access to independent guidance (discussed further below).
Drawdown phase accounts
Of the 38% of people in our sample with an account in the drawdown phase, most are receiving income from other sources in addition to their super (see chart 3).
Chart 3: Other sources of income for people in the drawdown phase of super4

People in the drawdown phase who have balances over $250,000 are much more likely to be receiving income from other investments than those with smaller balances. By comparison, people with less than $250,000 in super are much more likely to be receiving the Age Pension or another government payment. These results show that there is some correlation between super balances and wealth outside of super. Across all balance sizes, only 16% of people are receiving no income other than from their super.
Many retirees deliberately draw down their super at the minimum rate
Among people in our sample with a super account in the drawdown phase, well over half (61%) reported that they withdrew only the minimum amount allowed by legislation last financial year (2022-23). This was the case across all categories of balance size in our survey. By comparison, only about 23% of people in the drawdown phase said they regularly drew more than the minimum, and 15% said they also drew additional amounts (i.e. in addition to their regular drawdowns).
Once a super account is in the drawdown phase, a minimum percentage of the account balance must be withdrawn each year.5 The minimum percentage is currently 5% a year for people aged 65-74, increasing to 14% a year for people aged 95 or older. These rules were introduced to prevent large amounts of concessionally taxed super savings being passed on as bequests, and to ensure super savings are used to provide income over the course of a person’s retirement.6
Our survey findings about minimum drawdowns are similar to findings from Treasury’s Retirement Income Review, which observed that many retirees are drawing down at the minimum rate. It argued that this is resulting in many retirees under-spending in retirement.7
Our results are about drawdowns in 2022-23. This was an unusual year because, along with the three preceding financial years, the government had set the minimum drawdown rates at half their usual level, in response to the COVID-19 pandemic. When the rates were halved in early 2020, some retirees may have been automatically moved on to the new rate by their super fund (unless they opted out). Therefore, for some retirees, the decision to draw only the lower minimum rate may not have been deliberate.
However, our results suggest that most retirees who drew down at the minimum rate in 2022-23 were confident that this would meet their needs.
Why do people draw down their super at the minimum rate?
We asked the people in our survey who said they were drawing down their super at the minimum rate why they were doing so. There were a mix of reasons (see chart 4).
Chart 4: Reasons people gave for only drawing the legislated minimum from their superannuation8

The most common reason people gave for why they were drawing down at the minimum rate is that they don’t need to spend any more than they are spending now. Just over half (53%) of people gave this reason. For these people, the legislated minimum amount is enough, or more than enough, to meet their spending needs. In interviews, some people explained that:
“I just sit back a bit. My car’s only three years old and when that dies I’ll be too old to drive anyway. And I don’t drive very far. I have a very simple life really. I’ve got a very comfortable unit with beautiful views and I’ve turned into very much a homebody. And I’ve had a lot of health issues which is why I’m not traveling anymore.
— Female, retired
“At the moment, we really don’t need more… Our day-to-day expenses, the living expenses are met quite comfortably with that.
— Male, retired
The second most common reason people gave is that they are following advice they were given. Over a third (37%) of people drawing down at the minimum rate gave this reason. This advice makes sense for a retiree who has sufficient income from drawing down their super at the minimum rate and/or has other sources of income to meet their living costs. Keeping as much money in super for as long as possible allows people to maximise the tax concessions they receive.
This finding has important repercussions for policy makers drawn to the idea that increasing access to financial advice will necessarily lead to people drawing down more super. In fact, for some Australians the opposite may be true.
The third most common reason people gave is that they have other sources of income, such as income from investments or a partner’s super (as shown in chart 3). Just under a third (30%) of people gave this reason. This finding reiterates the importance of household circumstances in understanding people’s drawdown decisions. People who are receiving enough income from other sources to meet their spending needs are likely to have above-average levels of financial assets outside of super.9 These people can afford to minimise withdrawals from their super so as to maximise their tax concessions.
The fourth most common reason people gave is that they would run out of money too soon if they withdrew more. Just over a fifth (22%) of people gave this reason, and those with balances under $250,000 were more likely to give this reason (34%) than those with balances exceeding $500,000 (16%). However, contrary to common beliefs that concern about future health and/or aged care costs is a significant driver of retirees’ drawdown decisions,10 our survey results show that few people drawing down the minimum are doing so to preserve savings for future health and aged care costs (14%). Our results also show that very few people are drawing down at the minimum so they can leave money for their children or grandchildren (4%).
The fifth most common reason people gave for why they were drawing down at the minimum rate is that they thought the minimum is a government recommendation. Just under a fifth (19%) of people gave this reason. These people may be misunderstanding what the minimum rate represents. The legislated minimum is not a recommendation about how much an individual retiree should be spending each year. Rather, it is there to ensure some level of fairness within the super system by requiring people to draw money out of super and thus limit the extent to which retirees can benefit from tax concessions.
Additionally, 15% of people said they were drawing down at the minimum rate because it was the simplest thing to do. Some of these retirees may be confused or overwhelmed by the choice of how much to withdraw each year.
Overall, our findings show that a majority of people are confident that drawing down at the minimum rate will meet their needs. Almost everyone who was drawing down their super at the minimum rate said either that they feel financially comfortable (72%) or are getting by on their current income (24%). Most (79%) said they were confident that their super would last as long as they need it to, and two-thirds (68%) also said they often or sometimes had money left over.
The reason people only draw down at the minimum is often put down to factors such as a desire to avoid running out of savings and having a ‘nest egg’ mindset that super is not for spending.11 Our research shows that these factors only play into the thinking of a small minority of people. Around one in three people said they drew down their super at the minimum rate based on advice they had received, and around one in three said it was because they had supplementary income outside of super. For these people, drawing down at the minimum makes sense given the tax benefits of maximising their savings in super.
These results should give policy makers pause if they are considering more access to advice, guidance and products as solutions for getting retirees to spend more of their super. For retirees with significant wealth, continued minimum drawdown may be individually optimal. It will likely lead to them passing away with significant levels of super wealth left over,12 and shows a lack of alignment between current tax settings and the proposed objective of super.
Who is drawing more than the minimum and why?
Just 23% of people in our sample with a super account in the drawdown phase said that they were regularly drawing more than the legislated minimum. Of this group:
- 75% said that they were doing so to meet their living costs
- 22% said that they were doing so to keep some of their money outside super, such as in a bank account
- 9.1% said that they were doing so because they needed more money when the Government reduced the minimum drawdown rates.
People with larger balances were more likely to report regularly drawing down more than the minimum compared to those with smaller balances (31% versus 16%).13 Even so, the majority (60%) of people with larger balances were drawing down at the minimum rate.
About 15% of people were withdrawing irregular lump sums, for example, to pay for larger purchases (e.g. a holiday or new car). There was no clear relationship with balance size.
Many older Australians are confused about super and retirement
Our survey results show that many older Australians do not have a good understanding of the tax and policy settings that affect super:
- Only 51% of people in our sample said they definitely knew that most people aged over 60 don’t pay tax on withdrawals from super. Only 40% definitely knew that most over 60s don’t pay tax on earnings in the drawdown phase, and only 38% definitely knew that there was a tax of 15% on earnings in the accumulation phase. These proportions were lower for people with inactive accumulation accounts.
- As noted earlier, about a fifth (19%) of people with super in the drawdown phase who were drawing down at the minimum rate said they were doing this because it was a government recommendation (which it is not), and about 15% said it was because it was the simplest thing to do.
In interviews, some people explained that they found the retirement income system difficult to understand. For example:
“So they’ve got rules, and anti-rules, and God knows what else. It’s a minefield that, I’ll be quite honest, I don’t fully understand.
— Male, retired
“Super and planning for retirement, all that can be extremely stressful and all of a sudden you look into something that’s got all these long words and all these tax implications and this and that and you look at it and you think, “Oh. I’m not even going to bother opening it up.”
— Male, not retired
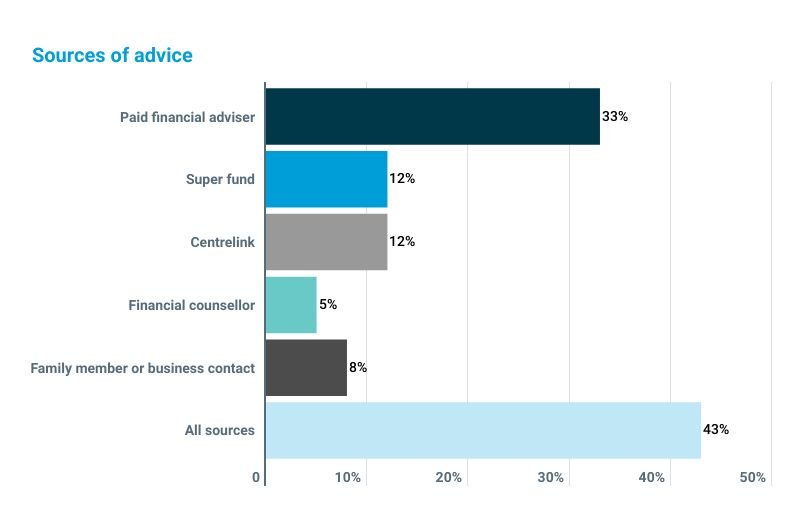
Our survey shows that relatively few people actively seek advice and guidance about retirement. Fewer than half (43%) of people said they have sought some kind of advice about money in retirement from one of the sources we listed (see chart 5).
Chart 5: Sources of advice people used about money in retirement:
This is consistent with our previous research, which found that people nearing retirement (from 45-80 years of age) approached retirement planning in three main ways:14
- 25% were engaged, but sought experts to help them make decisions
- 37% were engaged, but preferred to rely on themselves, rather than experts to do research and make decisions
- 38% were not engaged and spent no significant time planning for retirement.
Both our recent survey and our previous survey found that relatively few people actively seek advice and guidance about retirement.
Policy implications
Our survey results show that many older Australians are making decisions about their super that reflect their broader household circumstances, including those with inactive accumulation accounts and those who are drawing down their super at the minimum legislated rate.
Our results also highlight that expanding access to advice will not improve retirement outcomes for everyone, or even necessarily lead to more superannuation being consumed in retirement.
For people who are engaged with super and retirement, many are concerned about the level of trust they can place in advice and guidance from non-independent sources. For example, only 21% of survey participants said they would trust a super fund to give them advice about money in retirement, compared to 35% who said they would trust a government source such as the Australian Taxation Office or Moneysmart.
In interviews, some respondents said they were concerned about the reputation and trustworthiness of the advice industry. For example:
“I went to a couple of financial planners but one of them was with the bank and I just didn’t trust him. One of them never got back to me and the third one didn’t tell me any more than I already knew … So I guess I had a bit of distrust in financial planners at that stage as well, because for me they hadn’t worked out.
— Female, retired
“I thought I was making it the right [decision] but it was too complicated to go into looking at the other options so I took an option which I thought was reasonable and good but then, I should have probably got some advice but it’s getting that advice that you trust and that you can understand without somebody coming out and giving you a whole big plan of what you need to do so that you can be a millionaire when you retire.
— Male, not retired
The Government’s Quality of Advice Review focused on how to reduce the compliance costs of providing advice,15 but gave little attention to what consumers need from the retirement system to help them achieve better outcomes.
There is room for the Government to provide more free and independent advice to consumers. It should task an independent agency to connect Australia’s government-provided retirement planning services and tools through a single portal.16 Existing tools such as Moneysmart lack depth and the ability to easily input consumer data to assist people in making decisions.
The Government also needs to make the retirement system safer for everyone, not just those who are engaged or seek advice. Low levels of engagement are a tension for a super system that requires high levels of engagement to maximise retirement outcomes. The system has dealt with these issues in the accumulation phase through consumer protections such as regulated default products, performance tests and the Superannuation Guarantee. These safeguards aim to deliver better outcomes without the need for people to engage with questions they typically lack the time, knowledge or inclination to answer.
Equivalent safeguards do not exist in the drawdown phase. There are no default products, no performance tests and no recommended drawdown rates for retirees. These sorts of safeguards are likely to have a broader impact on improving retirement outcomes compared to advice solutions, which only reach a portion of engaged consumers.
Our results show why defaults in the drawdown phase will need to look beyond simple characteristics of super accounts. For example, many over 65s with inactive accumulation accounts are not ready to start spending their super, and the majority of people who are drawing from their super at the minimum legislated rate appear to be doing so deliberately. Both these groups could be financially worse off if compelled to take more money out of their super. Designing safe defaults that work well for the majority of disengaged people may require consideration of broader household circumstances. This could be facilitated by better information sharing between government agencies and super funds.
Appendix: About the survey sample
This survey was conducted by Susan Bell Research in August 2023 on behalf of Super Consumers Australia.
We surveyed 1,000 people aged 65 and older, recruited via two online platforms. An additional 100 people from typically harder to reach demographics were interviewed using Computer Aided Telephone Interviewing. The harder to reach demographics included people over the age of 75 and people who had a disability.
We targeted people over the age of 65 who had, or previously had, superannuation. All participants were screened for eligibility in the survey. Those who were under the age of 65 were excluded. People who only had a defined benefit superannuation account or who only had an annuity were also excluded. The survey includes a mixture of people with an institutional super fund and people with a self-managed super fund.
Quotas were used to achieve a balanced sample in terms of age, gender, location and education levels, based on ABS population-level statistics.
We compared the distribution of superannuation balances in our unweighted sample to data from the ABS.17 Overall, the distributions were similar. We found that a slightly higher share of single people aged 70-79 in our survey sample had a zero super balance compared to the ABS data. For couples, we found that a higher share of female respondents in our survey sample had zero super balances than in the ABS data (for all age groups), and a higher share of male respondents in our survey sample had balances greater than $750,000 (for all age groups). The survey sample also broadly reflects the distribution of demographic characteristics in the population. Nevertheless our survey results are weighted using ABS data on age, gender, location and education levels to improve the representativeness of the results.
The following tables provide some demographic information on the entire survey sample (table 1), and for survey respondents who had a superannuation account in the drawdown phase (table 2).
Table 1: Demographics of our survey sample
| Gender | Unweighted | Weighted |
| Male | 49.5% | 50.8% |
| Female | 50.5% | 49.2% |
| Non-binary | 0.0% | 0.0% |


Table 2: Demographics of the subsample with super accounts in the drawdown phase


Footnotes
1Treasury, Retirement Income Review, Final Report, July 2020.
2John Daley and Brendan Coates, Money in retirement: More than enough, Grattan Institute, November 2018.
3Data weighted by age, location, gender and education level. Percentages for each category do not sum to 100% because some respondents have more than one type of account. In this chart, we have not counted volunteering as ‘work’ and have assumed all respondents who were not working had retired.
4Data weighted by age, location, gender and education level. Percentages for each balance category do not sum to 100% because some respondents have more than one other source of income.
5These rules apply to account-based pensions. Different rules apply to other retirement products, such as defined benefit pensions and annuities. Our survey sample excludes people with these other types of products.
6Treasury, Retirement Incomes Streams Review, May 2016; Minister for Revenue and Assistant Treasurer, Explanatory Statement to Select Legislative Instrument 2007 No. 74, 2007.
7Treasury, Retirement Income Review, Final Report, July 2020.
8Data weighted by age, location, gender and education level. Respondents were only asked this question if they had a superannuation account in the drawdown phase and were drawing down regularly at the minimum rate. Figures do not sum to 100% because some respondents selected more than one reason.
9Our survey did not ask respondents to disclose their overall levels of wealth. Analysis of ABS data shows that 35% of households aged over 65 have more than $100,000 in financial (non-property) assets outside of super. Just over a third (37%) of households with super balances in the top 15% of all balances have over $365,000 in financial assets outside super. Source: Australian Bureau of Statistics, Survey of Income and Housing 2019-20.
10Treasury, Retirement Income Review, Final Report, July 2020; Challenger and National Seniors Australia, Feeling financially comfortable? What retirees say, March 2019.
11Treasury, Retirement Income Review, Final Report, July 2020, pp. 439, 446.
12Treasury, Retirement Income Review, Final Report, July 2020, p. 182.
13 Larger balances are greater than $250,000 and smaller balances are less than that. The Retirement Income Review made a similar finding (p. 433).
14FiftyFive5, Retirement Planning Survey, Super Consumers, February 2021
15Treasury, Quality of Advice Review, Final Report, December 2022.
16Super Consumers Australia, Quality of Advice Review Proposals Paper – Give people an independent retirement service, September 2022.
17We used data from the ABS Survey of Income and Housing (SIH) 2019-20. To allow for the time difference between when the SIH was conducted and when our survey was conducted, we examined age cohorts from the SIH that were three years younger than for our survey sample, and adjusted their super balances according to: the quarter of the year they were surveyed, the median super returns to June 2023, and the applicable minimum drawdown rate for each age cohort. This procedure therefore updated the SIH 2019-20 super balances to June 2023 to enable a comparison with this survey.
18Totals may exceed 100% as some respondents reported having more than one super account.